
Immerse yourself in a virtual reality like experience for two exciting hours, where you will learn the latest and the greatest features of the Denodo Platform using a real-life example on AWS Cloud. The Test Drive will walk you through an agile BI and Analytics use case scenario using the data virtualization capabilities of the Denodo Platform.
Here are the top three reasons why you should experience the Test Drive for yourself, whether you are a data architect, a business analyst, a BI modeler/developer, or a data scientist:
- It showcases how to solve a real-world scenario using a large volume of data, which you cannot experience in a demo.
- It illustrates the ease with which disparate data sources in the cloud ecosystem can be combined as virtual data service layer on AWS Cloud, and it lets you quickly learn through hands-on experimentation.
- Best of all, it’s free, including the AWS Infrastructure costs.
Fasten Your Seat Belts
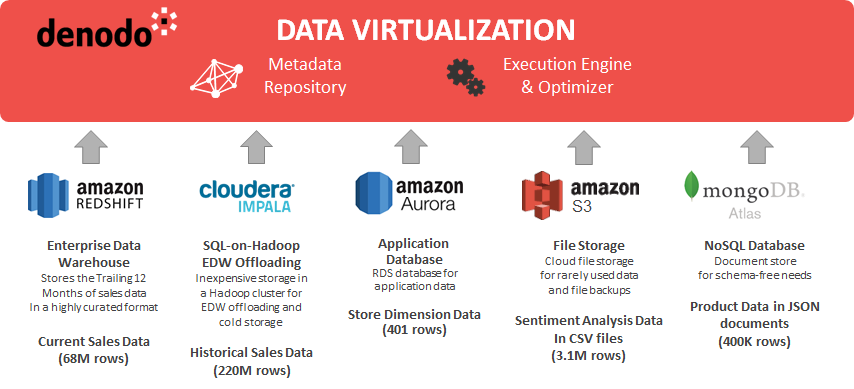
The use case scenario in the Test Drive shows how Retail users can integrate and combine data from different big data sources (structured and unstructured) and present them to the analysts and data scientists as a single, integrated data fabric. The diagram below shows the variety of data sources covered in the Test Drive.
It has become ever more important to leverage a data virtualization layer to provide users with self-service capabilities without having to move the underlying data and in a real time fashion. It becomes even more important in the cloud, where there is network latency involved. The right optimization strategies and performance characteristics are key to providing the optimal time-to-value and design choices. Users can access the data using their preferred visualization tools, such as Tableau or Zeppelin workbench.
Inside the Test Drive Infrastructure
Let’s take a closer look at the Test Drive, which starts with a simple registration form or a login using your existing Denodo Community account.
Once you log in, the Test Drive environment (an AWS EC2 instance) will launch in the background and will also provide the connection details on the webpage.
A HTML style user guide will walk you through the Agile/BI scenario.
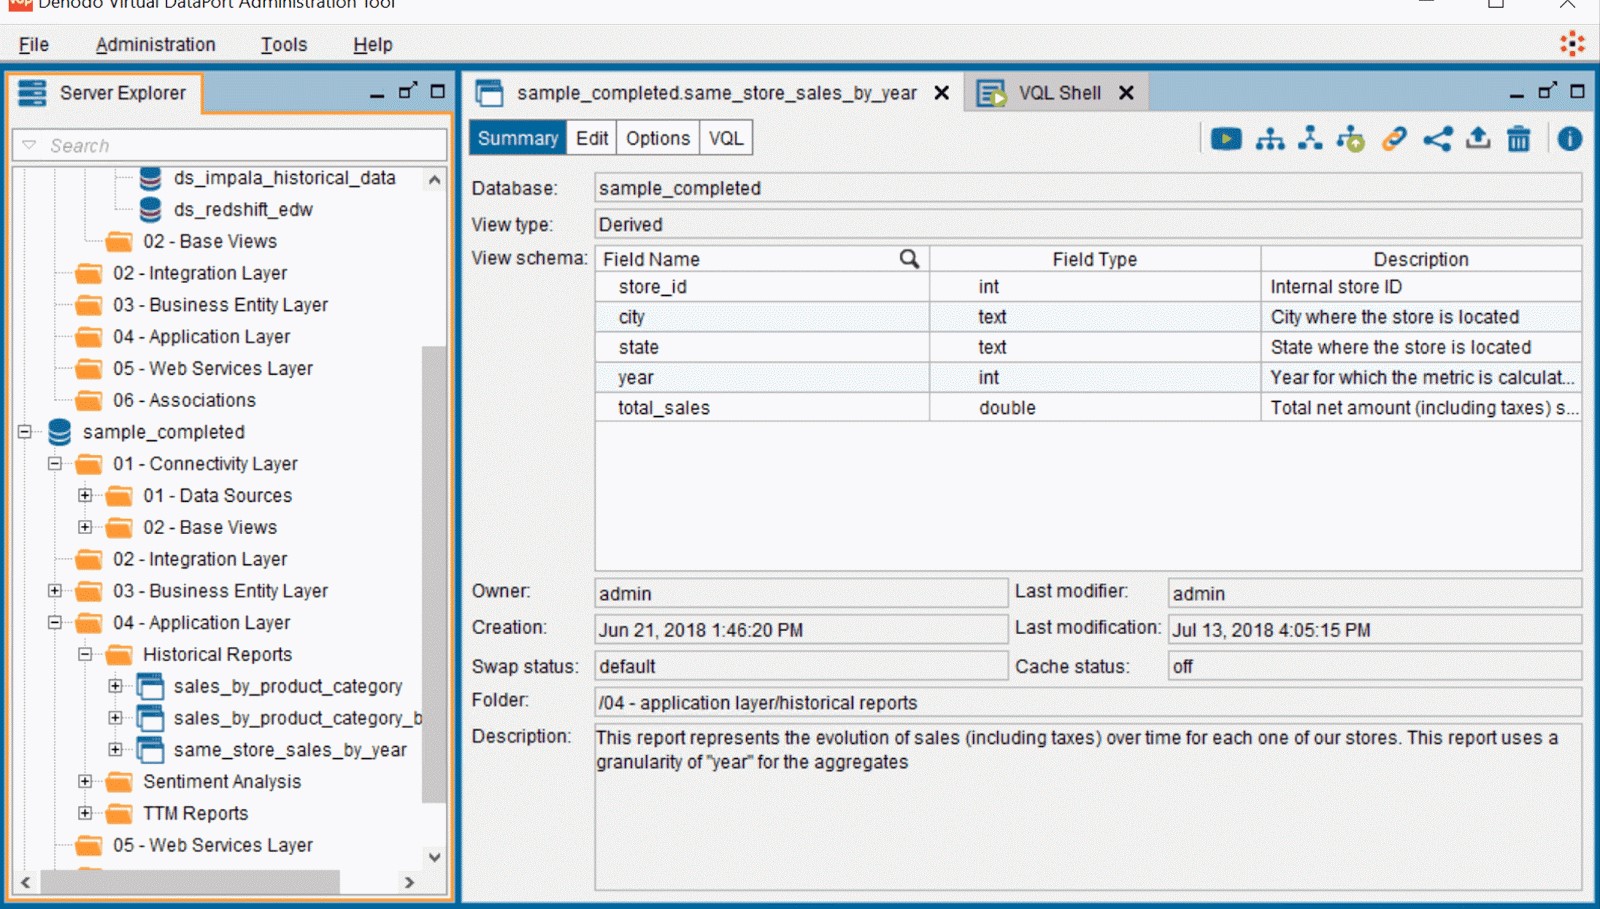
You will use the Denodo Virtual DataPort Administration Tool to navigate through the key steps and the use case. The figure below shows a high-level view of the administration tool, which you will use the most.
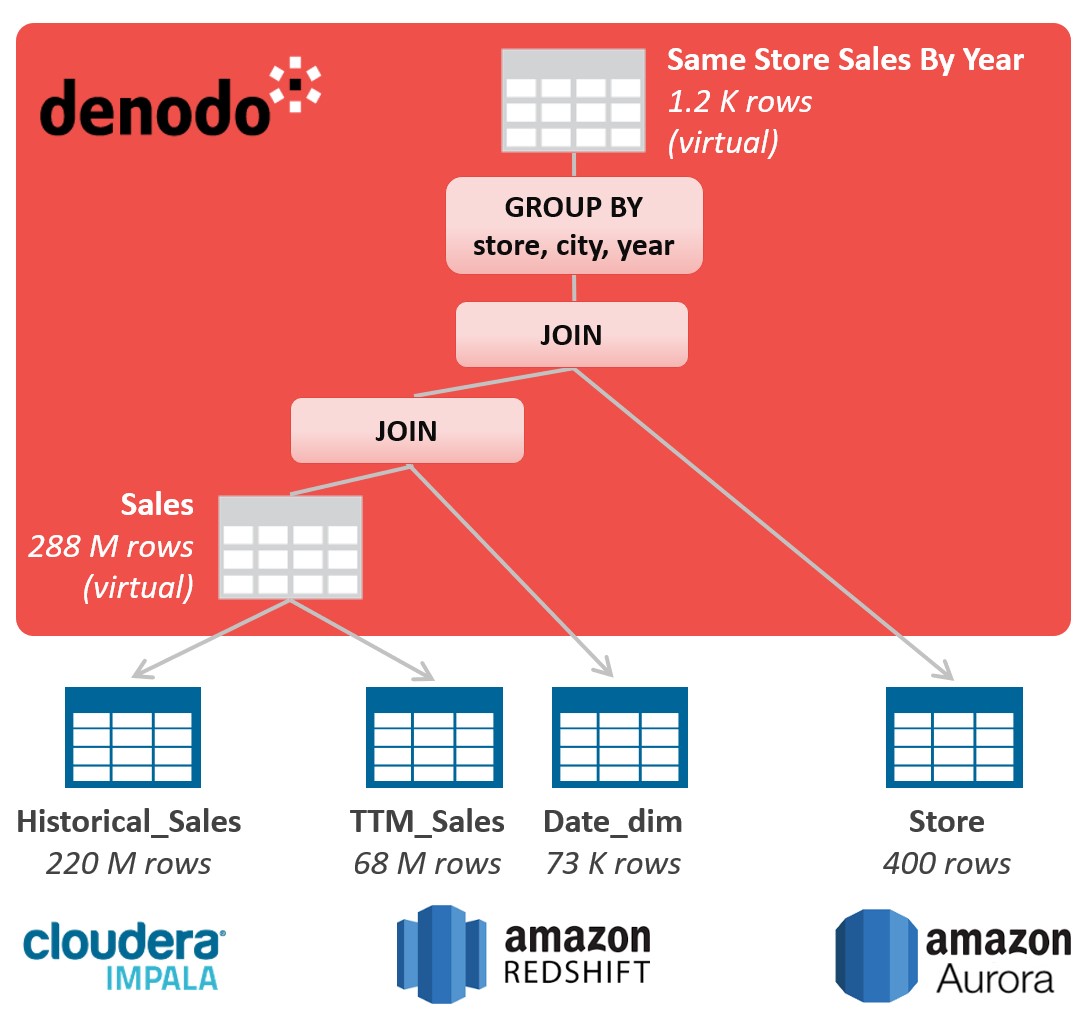
The Test Drive walks you through the performance optimization capabilities, and the best practices involved in quickly building/defining the data model. There will be different examples for you to play around with such as generating a sample BI view/report called “Same Store Sales by Year” to provide retail business users with insights derived from a TPC-DS data set. Below is a graphic representation of the SQL Query and the table joins used to generate the BI report.
The Test Drive also demonstrates how to leverage the MongoDB API to retrieve JSON data, along with the Customer_sentiment data in CSV style format, which is stored in Amazon S3.
As you can see, the Test Drive offers a rich set of interesting learning opportunities using a real world scenario. I encourage you to take the test drive to see it for yourself.
You can get started here.
Don’t miss any debate-style 3-part Experts Roundtable Series, and watch cloud service providers, systems integrators, and customer organizations duel it out with their insights into the statistics published from Denodo’s 2020 Global Cloud Survey.